Log serviceを使用すると、インターネットインフォメーションサービス (IIS) アクセスログを収集および分析できます。 このトピックでは、IISアクセスログを使用してWebサイトへのアクセスを監視および分析する方法について説明します。 ページビュー (PV) 、ユニークビジター (UV) 、リクエスタの場所、エラーリクエスト、受信および送信トラフィックなどのデータを取得できます。
始める前に
IISログが収集されます。 詳細については、「IIS構成モードでログを収集する」をご参照ください。
説明 収集プロセス中、Log Serviceはログの内容に基づいてインデックスを自動的に生成します。 必要に応じてインデックスを変更できます。 詳細については、「インデックスの作成」をご参照ください。
このタスクについて
IISは、webサイトの構築とホストに使用できる安全なwebサーバーです。 IISを使用してWebサイトを構築すると、IISアクセスログを収集して分析できます。
次のIIS W3C拡張ログ形式を使用することを推奨します。
logExtFileFlags="Date, Time, ClientIP, UserName, SiteName, ComputerName, ServerIP, Method, UriStem, UriQuery, HttpStatus, Win32Status, BytesSent, BytesRecv, TimeTaken, ServerPort, UserAgent, Cookie, Referer, ProtocolVersion, Host, HttpSubStatus"サンプルIISログの例を次に示します。
# Software: Microsoft Internet Information Services 7.5
# Version: 1.0
# Date: 2020-09-08 09:30:26
# Fields: 日付時間s-sitename s-ip cs-方法cs-uri幹cs-uri-クエリs-ポートcs-ユーザー名c-ip cs(User-Agent) sc-状態sc-substatus sc-win32-status sc-バイトcs-バイト時間撮影
2009-11-26 06:14:21 W3SVC692644773 125.67.67。* GET /index.html - 80 - 10.10.10.10 Baiduspider +(+ http://www.example.com)200 0 64 185173 296 0- フィールドの接頭辞
接頭辞 説明 s- Indicatesサーバアクション。 c- クライアントのアクションを示します。 cs- クライアントからサーバーへのアクションを示します。 sc- サーバー間アクションを示します。 - フィールド
フィールド 説明 date クライアントがリクエストを送信する日付。 time クライアントがリクエストを送信する時点。 s-sitename クライアントがアクセスしたサイトのインターネットサービス名とインスタンスID。 s-computername ログが生成されるサーバーの名前。 s-ip ログが生成されるサーバーのIPアドレス。 cs-method クライアントが使用するリクエストメソッド (GETやPOSTなど) 。 cs-uri-stem リクエスト内のURI。 cs-uri-query HTTPリクエストの疑問符 (?) に続くクエリ文字列。 s-port サーバーのポート番号。 cs-username クライアントがサーバーにアクセスするために使用する認証済みドメイン名またはユーザー名。 - 認証されたユーザーは、
Domain\Username形式で表示されます。 - 匿名ユーザーはハイフン(-)で表示されます。
c-ip リクエストを送信するクライアントの実際のIPアドレス。 cs-version HTTP 1.0やHTTP 1.1など、クライアントが使用するプロトコルのバージョン。 cs(User-Agent) クライアントが使用するブラウザ。 Cookie 送信または受信されるcookieの内容。 Cookieが送受信されない場合は、ハイフン (-) が表示されます。 referer クライアントが指示されたサイト。 cs-host ホスト情報。 sc-status サーバーから返されたHTTPステータスコード。 sc-substatus The HTTP substatusコードによって返さサーバー。 sc-win32-status The Windowsステータスコードによって返さサーバー。 sc-bytes サーバーによって送信されたバイト数。 cs-bytes The番号のバイト受信します。 time-taken リクエストの処理に必要な時間。 単位:ミリ秒。 - 認証されたユーザーは、
手順
- Log Service コンソールにログインします。
- [プロジェクト] セクションで、表示するプロジェクト名をクリックします。
- を選択します。 [Logstore] タブで、表示する Logstore をクリックします。
- 検索ボックスにクエリステートメントを入力し、時間範囲を選択します。
クエリステートメントは、searchステートメント | analyticステートメント形式の検索ステートメントと分析ステートメントで構成されます。 詳細については、「クエリ構文」と「SQL構文と関数」をご参照ください。
- クライアントIPアドレスの分布に関する統計を収集するには、次のクエリステートメントを実行します。
* | ip_to_geo("c-ip") を国として選択し、ip_to_geo("c-ip") 制限100によってcグループとしてカウント (1) - PVおよびUVの数を計算するには、次のクエリステートメントを実行します。
*| select approx_distinct("c-ip") as uv ,count(1) as pv , date_format(date_trunc('hour', __time__), '%m-%d %H:%i') as time group by date_format(date_trunc('hour', __time__), '%m-%d %H:%i') order by time limit 1000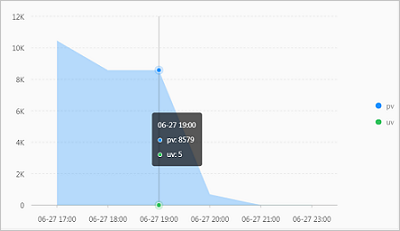
- 返される各HTTPステータスコードの割合を計算するには、次のクエリステートメントを実行します。
*| select count(1) as pv ,"sc-status" group by "sc-status"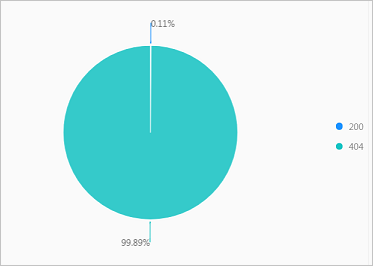
- インバウンドトラフィックとアウトバウンドトラフィックの統計を収集するには、次のクエリ文を実行します。
*| select sum("sc-bytes") as net_out, sum("cs-bytes") as net_in ,date_format(date_trunc('hour', time), '%m-%d %H:%i') as time group by date_format(date_trunc('hour', time), '%m-%d %H:%i') order by time limit 10000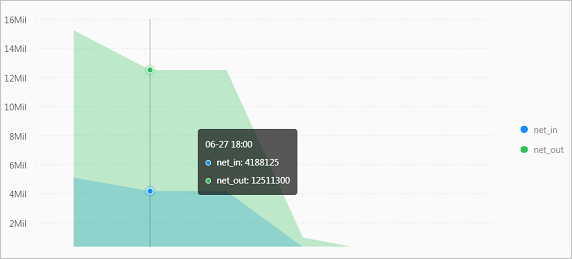
- 各リクエストメソッドの割合を計算するには、次のクエリステートメントを実行します。
*| select count(1) as pv ,"cs-method" group by "cs-method"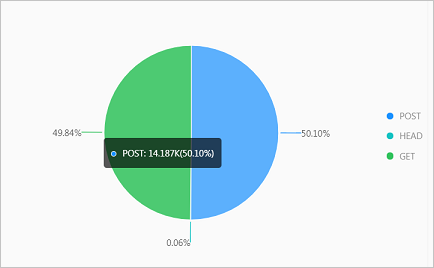
- 各ブラウザータイプの割合を計算するには、次のクエリ文を実行します。
*| select count(1) as pv, case when "user-agent" like '%Chrome%' then 'Chrome' when "user-agent" like '%Firefox%' then 'Firefox' when "user-agent" like '%Safari%' then 'Safari' else 'unKnown' end as "user-agent" group by case when "user-agent" like '%Chrome%' then 'Chrome' when "user-agent" like '%Firefox%' then 'Firefox' when "user-agent" like '%Safari%' then 'Safari' else 'unKnown' end order by pv desc limit 10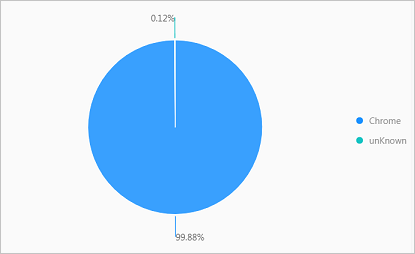
- 最も頻繁にアクセスされる上位10ページを計算するには、次のクエリ文を実行します。
*| select count(1) as pv, split_part("cs-uri-stem",'?',1) as path group by split_part("cs-uri-stem",'?',1) order by pv desc limit 10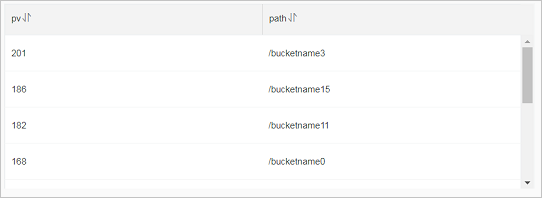
- クライアントIPアドレスの分布に関する統計を収集するには、次のクエリステートメントを実行します。