Elasticsearch は、オープンソースの Elasticsearch v5.5.3 と X-Pack Business Edition を提供し、データ分析やデータ検索などのシナリオに対応します。 エンタープライズレベルの権利管理、セキュリティモニタリングアラート、自動レポート生成など、さまざまな機能がオープンソースの Elasticsearch に基づいて作成されています。
モニタリングログの設定
ログ収集デフォルトでは、X-Pack はクライアントをモニタリングし、購入したインスタンスの .monitoring-* という接頭辞が付いたインデックスに、収集したクラスター情報を 10 秒ごとに送信します。
インデックス .monitoring-es-6-* と .monitoring-kibana-6-* が利用可能で、毎日作成されます。 収集された情報は .monitoring-es-6- という接頭辞のインデックスに保存され、現在の日付が末尾に付けられます。
.monitoring-es-6-* インデックスは、比較的大きなディスク容量を占有します。 クラスターのステータス、クラスター統計、ノード統計、インデックス統計などの情報を保存します。
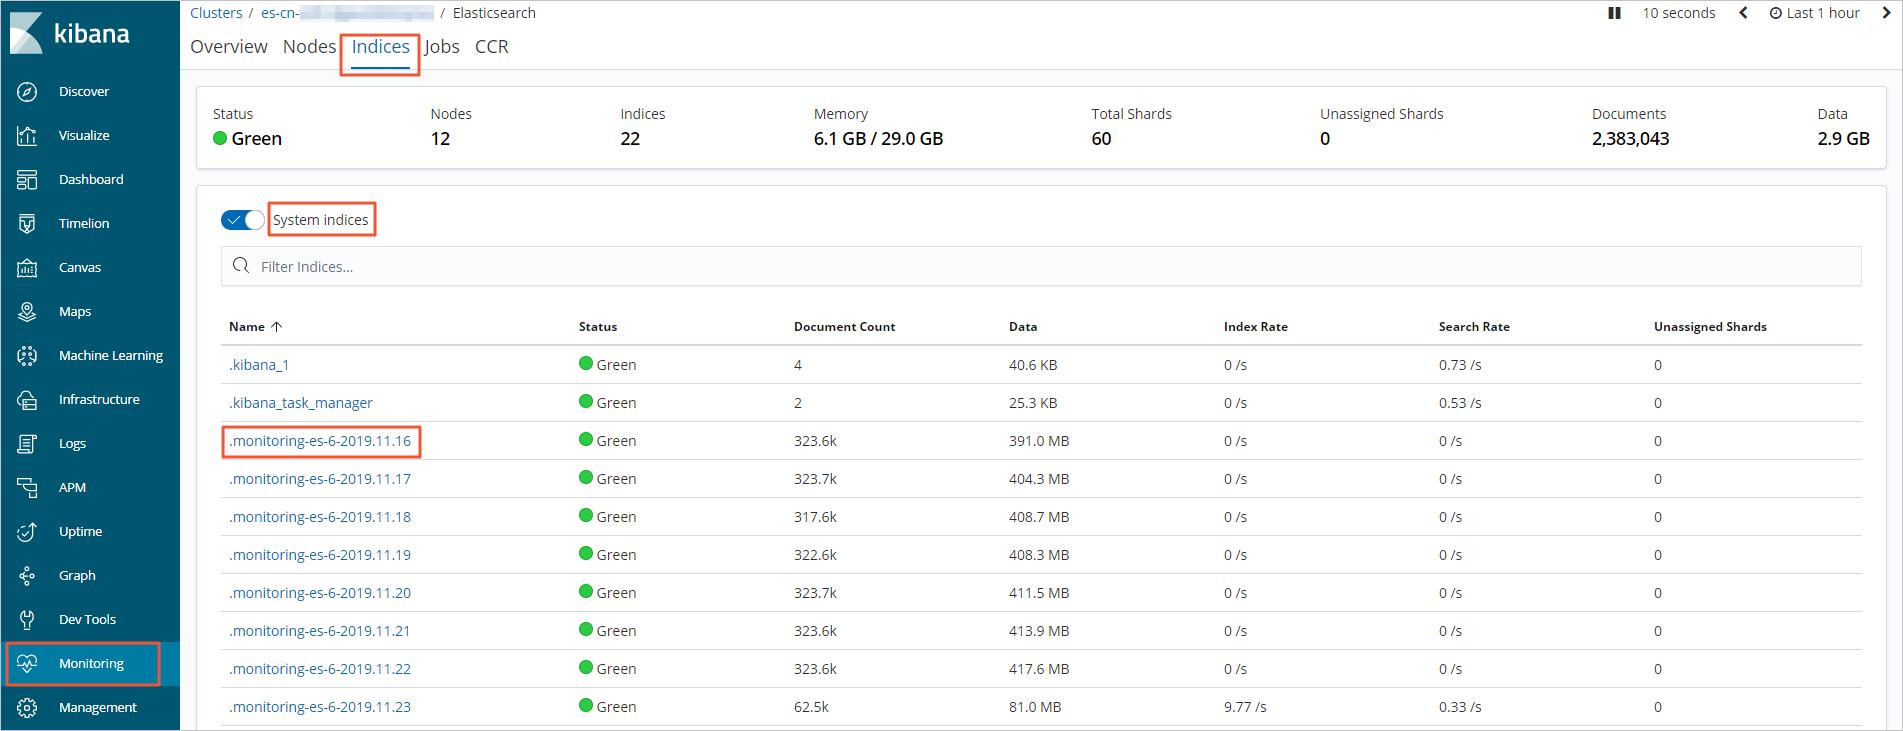
システムインデックスの表示Kibana ページで [Show system indices] を選択すると、インデックスが占有する容量が表示されます。
 ログ保存
ログ保存デフォルトでは、過去 7 日間のモニタリング対象のインデックスが保存されます。 これらの .monitoring-es-6-* インデックスは、ES インスタンスの容量を占有します。 インデックスサイズは、クラスター内のインデックス数 (システムインデックスを含む) とノード数によって異なります。 インデックスがインスタンス容量の大半を占有しないようにするには、次の方法を使用します。
- 次の API を使用して、インデックス保持日数を設定する
PUT _cluster/settings {"persistent": {"xpack.monitoring.history.duration":"1d"}} # The number of days shall be configured according to your requirements. The indexes shall be retained at least one day. - モニタリング対象のインデックスを指定する
API でモニタリングする必要のあるインデックスを指定することで、.monitoring-es-6-* インデックスが占有するディスク容量を削減できます。 次の例では、システムインデックスはモニタリングされません。
PUT _cluster/settings
{"persistent": {"xpack.monitoring.collection.indices": "*,-. *"}}
# The disabled index information is not displayed in the Monitoring module of Kibana. For example, you cannot see the disabled index information in the index list or on the index monitoring page. In this situation, the index list obtained through _cat/indices is different from the index list displayed in the Monitoring module of Kibana.