This topic uses a basic flat map as an example to describe how to use the Regional Thermal Layer widget to customize map boundaries.
Procedure
Go to the DataV console .
On the My Visualizations page, click Edit above the created visualization project.
In Canvas Editor, click the
 icon in the upper-left corner to show Assets.
 Choose Maps> Basic Flat Map to add a basic flat map widget to the canvas.
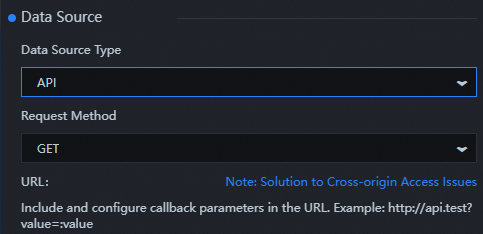
In the Data panel of the Regional Thermal Layer component, select Geo Boundary geojson Data Interface and set Data Source Type to API.
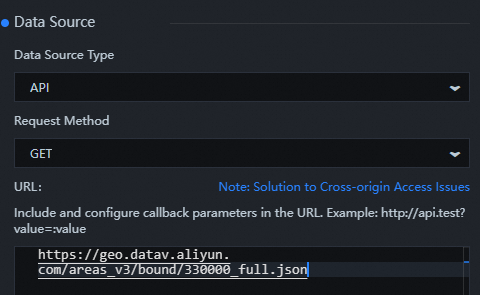
Log on to the DataV.GeoAtlas, select Range Selector, and copy the JSON API of Zhejiang Province.
Return to the Data configuration panel of the regional heating layer.
Paste the copied API link into the URL input box of Geo-boundary geojson Data Interface.
Click the
 icon in the upper-right corner of the page to adjust the zoom and position of the map and preview the result of custom boundary data settings.