You can monitor the health status of your Elastic Compute Service (ECS) instances to ensure that your users can always access your websites and applications, process data, or render videos. Alibaba Cloud allows collection and visualization of monitoring data, and provides real-time alerts to help ensure that your ECS instances run as expected.
Background information
You can monitor your ECS instances in the ECS or CloudMonitor console.
ECS console: You can monitor vCPU utilization, network traffic, and disk I/O operations.
CloudMonitor console: You can monitor resources in a more fine-grained manner.
Metrics
The following section describes the monitoring metrics for ECS instances:
vCPU utilization: the percentage of allocated compute units that are in use on an ECS instance. A higher percentage indicates a higher vCPU load on the instance. You can view the monitoring data of an ECS instance in the ECS or CloudMonitor console or by calling ECS API operations. You can also connect to an ECS instance to view the monitoring data of the instance.
To view the vCPU utilization of an ECS instance after you connect to the instance, you can use one of the following methods:
Windows instance: View the vCPU utilization in Task Manager. You can sort processes by vCPU utilization to identify processes that consume the vCPUs of the instance.
Linux instance: Run the top command on the instance to view the vCPU utilization of the instance. Press Shift+P to sort processes by vCPU utilization and identify processes that consume the vCPUs of the ECS instance.
Network traffic-related metrics: the inbound and outbound bandwidth usages of the ECS instance in Kbit/s.
ECS monitors public bandwidth usage. CloudMonitor monitors public and internal bandwidth usage. If an outbound public bandwidth of 1 Mbit/s is allocated to an ECS instance and the outbound public bandwidth usage by the instance reaches 1,024 Kbit/s, the allocated outbound public bandwidth is considered to be fully utilized.
NoteThe monitoring data of public bandwidth over the classic network does not include back-to-origin traffic. You can view the complete monitoring data in the CloudMonitor console.
View monitoring data in the ECS console
Log on to the ECS console.
In the left-side navigation pane, choose .
In the top navigation bar, select the region and resource group to which the resource belongs.

Find the ECS instance whose monitoring data you want to view and click the instance ID.
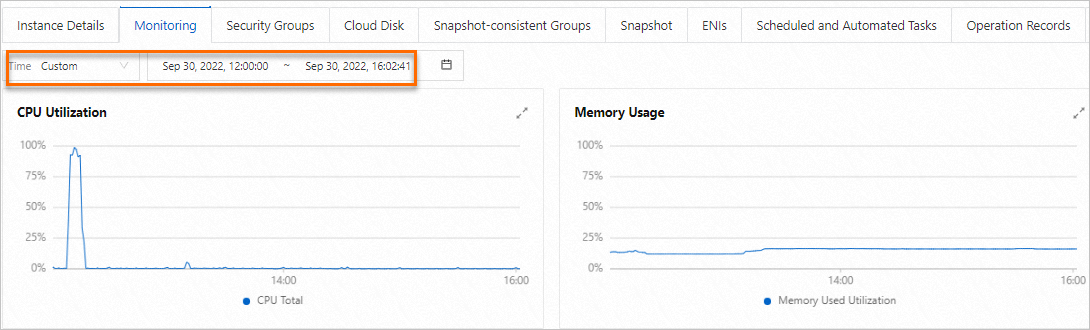
On the Instance Details page, click the Monitoring tab.
Specify a time range to query the monitoring data of the instance, such as vCPU utilization and memory usage.
The granularity of the displayed data varies based on the length of the specified time range. A shorter time range indicates a higher resolution of displayed data. For example, the aggregation interval is different for a 1-hour period and a 6-hour period, which results in different average values. You can specify a time range based on your business requirements.
 Note
NoteYou can also call ECS API operations, such as DescribeInstanceMonitorData, DescribeDiskMonitorData, and DescribeEniMonitorData, to query monitoring data.
The monitoring data of an ECS instance that you can view in the ECS console varies based on whether the CloudMonitor agent is installed on the instance.
If the CloudMonitor agent is installed on the ECS instance, the operating system metrics from CloudMonitor are displayed in the ECS console, and the data of the other metrics displayed in the ECS console is the same as the data of basic metrics displayed in the CloudMonitor console. CPU utilization, memory usage, and system load are operating system metrics for which data is obtained from instance operating systems.
If the CloudMonitor agent is not installed on the ECS instance, the data of metrics in the ECS console is the same as the data of basic metrics in the CloudMonitor console.
NoteOperating system metrics are collected every 15 seconds. Basic metrics are collected every 1 minute. For more information, see Operating system monitoring.
The following table describes the metrics of instances on which the CloudMonitor agent is not installed. The collection interval is 1 minute.
Metric
Description
Unit
MetricName
Dimensions
Statistics
(ECS) CPU Utilization
CPU utilization
%
CPUUtilization
userId and instanceId
Maximum, Minimum, and Average
(ECS)InternetInRate(Classic Network)
Average rate of inbound traffic over the Internet
bit/s
InternetInRate
userId and instanceId
Maximum, Minimum, and Average
(ECS)IntranetInRate
Average rate of inbound traffic over the internal network
bit/s
IntranetInRate
userId and instanceId
Maximum, Minimum, and Average
(ECS)InternetOutRate(Classic Network)
Average rate of outbound traffic over the Internet
bit/s
InternetOutRate
userId and instanceId
Maximum, Minimum, and Average
(ECS)IntranetOutRate
Average rate of outbound traffic over the internal network
bit/s
IntranetOutRate
userId and instanceId
Maximum, Minimum, and Average
(ECS)DiskReadBPS
Number of bytes that are read from the system disk per second
Byte/s
DiskReadBPS
userId and instanceId
Maximum, Minimum, and Average
(ECS)DiskWriteBPS
Number of bytes that are written to the system disk per second
Byte/s
DiskWriteBPS
userId and instanceId
Maximum, Minimum, and Average
(ECS)DiskReadIOPS
Number of read operations that are performed on the system disk per second
Count/s
DiskReadIOPS
userId and instanceId
Maximum, Minimum, and Average
(ECS)DiskWriteIOPS
Number of write operations that are performed on the system disk per second
Count/s
DiskWriteIOPS
userId and instanceId
Average, Minimum, and Maximum
(ECS)InternetInRate_IP
Inbound bandwidth over the Internet
bit/s
VPC_PublicIP_InternetInRate
userId, instanceId, and ip
Maximum, Minimum, and Average
(ECS)InternetOutRate_IP
Outbound bandwidth over the Internet
bit/s
VPC_PublicIP_InternetOutRate
userId, instanceId, and ip
Maximum, Minimum, and Average
(ECS)InternetOutRatePercent_IP
Utilization of the outbound bandwidth over the Internet
%
VPC_PublicIP_InternetOutRate_Percent
userId, instanceId, and ip
Average
(ECS)InternetIn(Classic Network)
Inbound traffic over the Internet
Byte
InternetIn
userId and instanceId
Average, Minimum, Maximum, and Sum
(ECS)InternetOut(Classic Network)
Outbound traffic over the Internet
Byte
InternetOut
userId and instanceId
Maximum, Minimum, and Average
(ECS)IntranetInRate
Inbound traffic over the internal network
Byte
IntranetInRate
userId and instanceId
Maximum, Minimum, and Average
View monitoring data in the CloudMonitor console
CloudMonitor provides end-to-end and out-of-the-box monitoring solutions for enterprises in the cloud. CloudMonitor provides the host monitoring service to monitor ECS instances. For more information about the host monitoring service, see Overview. For information about the host monitoring metrics, see Operating system monitoring.
To monitor the utilization of various cloud resources, create alert rules in the CloudMonitor console. If resource metrics meet specific alert conditions, alerts are triggered and CloudMonitor sends alert notifications. This way, you can identify and handle monitoring data exceptions at the earliest opportunity. For more information, see Create an alert rule.
Log on to the CloudMonitor console.
In the left-side navigation pane, click Host Monitoring.
Optional. On the Host Monitoring page, find and select the ECS instance whose monitoring data you want to view. In the lower part of the page, click Batch Install and then click OK.
If the CloudMonitor agent is not installed on the ECS instance, you can install the agent on the instance. For more information, see Install and uninstall the CloudMonitor agent for C++.
If the CloudMonitor agent is not installed on the ECS instance, you can view only basic metrics in the CloudMonitor console.
If the CloudMonitor agent is installed on the ECS instance, you can view basic metrics and operating system metrics in the CloudMonitor console.
On the Host Monitoring page, click the ID of the instance whose monitoring data you want to view. On the Basic Monitoring and OS Monitoring tabs, view monitoring data.
NoteMonitoring data can be retained for up to 30 days.